


538 videos, with a total of 179,336 frames and 6,431 seconds, were collected, according to the following four criteria: (1) Diverse video content. Videos with diverse content were sourced from different online-accessible repositories, such as daily vlogs, documentaries, movies, sport casts, TV shows, and so forth. (2) Including at least one object. Only videos with at least one object were qualified for our database. (3) High quality. We ensured the high quality of videos in our database by selecting those with at least a 720p resolution and 24 Hz frame rate. To avoid quality degradation, the bit rates were maintained when converting the videos to the uniform MP4 format. (4) Stable shot. Videos with unsteady camera motions and frequent cinematic cuts were not included in LEDOV. Specifically, there are 212 videos with stable camera motion. The other 316 videos are without any camera motion.
-
Procedure
For monitoring the binocular eye movements, a Tobii TX300 eye tracker was used in our experiment. Moreover, 32 participants (18 males and 14 females), aging from 20 to 56 (32 on average), were recruited to participate in the eye-tracking experiment. All participants were non-experts for the eye-tracking experiment, with normal/corrected-to-normal vision.
Since visual fatigue may arise after viewing videos for a long time, the 538 videos in LEDOV were equally divided into 6 non-overlapping groups with similar numbers of videos in terms of content (i.e., human, animal and man-made object). During the experiment, each subject was seated on an adjustable chair at approximately 65 cm from the screen, followed by a 9-point calibration. Then, the subject was required to free view the 6 groups of videos in a random order. In each group, the videos were also displayed at random. Between two successive videos, we inserted a 3-second rest period with a black screen and a 2-second guidance image with a red circle in the screen center. Thus, the eyes can be relaxed, and then the initial gaze location can be reset to center. After viewing a group of videos, the subject was asked to take a break until he/she was ready to view the next group of videos. Finally, 5,058,178 fixations (saccades and other eye movements have been removed) were recorded from 32 subjects on 538 videos, for our LEDOV database.

Examples for human fixation maps across consecutive frames
-
Demos
-
Reference
-
Lai Jiang, Mai Xu, Zulin Wang. Predicting Video Saliency with Object-to-Motion CNN and Two-layer Convolutional LSTM. arXiv preprint arXiv:1709.06316. 2017.
-
Videos
-
Observations
1. Temporal correlation of attention on consecutive frames.
As shown in figure below, there exists a high temporal correlation of attention across consecutive frames of videos. To quantify this correlation, we further measure the linear correlation coefficient (CC) of the fixation map between two consecutive frames. In the histogram, we plot the averaged CC results of 4 sets, ,i.e., 0-0.5 s before, 0.5-1 s before, 1-1.5 s before and 1.5-2 s before, as well as the baseline of the averaged CC between fixation maps of one subject and the remainder (indicating attention correlation between humans). As shown in this histogram, the CC value of temporal consistency is considerably higher than that of the one-vs-all baseline. This implies a high temporal correlation across consecutive frames of video. We can further find that the temporal correlation of attention decreases as the distance between the current and previous frames increases.
2. Correlation between objectness and human attention.
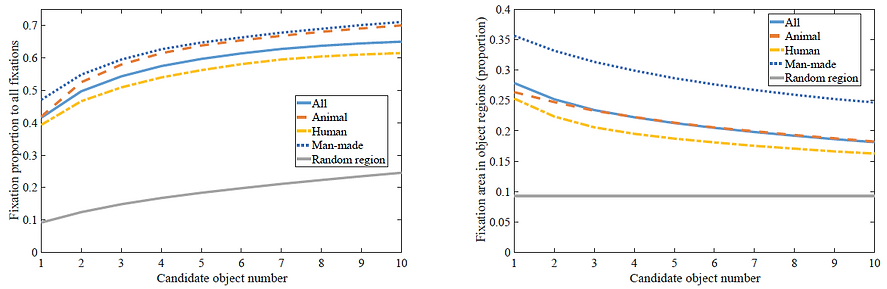
It is intuitive that people may be attracted to objects rather than background when watching videos. Therefore, we investigate how much attention is related to object regions. First, we apply a CNN-based objection detection method named YOLO to detect the main objects in each video frame. Here, we generate different numbers of candidate objects in YOLO, via setting thresholds of confidence probability and non-maximum suppression. We can observe from the figure that attention is normally attended to object regions, and more human fixations can be included along with an increased number of detected candidate objects.
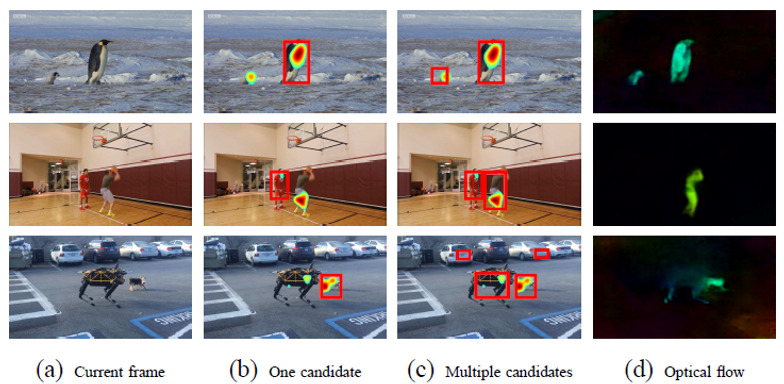
Examples of ground-truth fixation maps and candidate objects detected by YOLO. (a) shows randomly selected frames from three videos in our LEDOV database. (b) illustrates the fixation maps as well as one candidate object in each frame. (c) demonstrates fixation maps and multiple candidate objects. (d) displays optical flow maps of each frame, represented in HSV color space.
3. Correlation between motion and human attention.
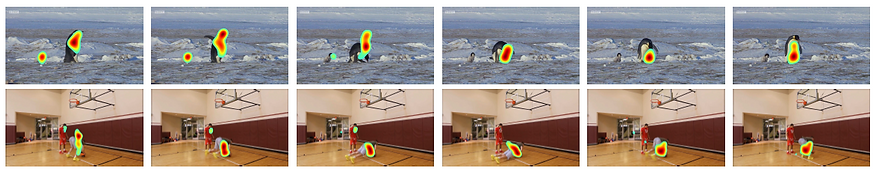
From our LEDOV database, we find that human attention tends to focus on moving objects or the moving parts of objects. Specifically, as shown in the first row of the figure below, human attention is transited to the large penguin when it suddenly falls with a rapid motion. Additionally, the second row of the figure shows that in the scene with a single salient object, the intensive moving parts of the player may attract considerably more fixations than the other parts. It is interesting to further explore the correlation between motion and human attention inside the regions of objects. Here, we apply FlowNet which is a CNN-based optical flow method, to measure the motion intensity in all frames. At each frame, pixels are ranked according to the descending order of motion intensity. Subsequently, we cluster the ranked pixels into 10 groups with equal number of pixels over all video frames in the LEDOV database. For example, the first group includes pixels with top 10% ranked motion intensity. The numbers of fixations falling into each group are shown in the histogram. We can see that 44.9% of the fixations belong to the group with the top 10% high-valued motion intensity. This result implies a high correlation between motion and human attention within the region of objects.

Attention heat maps of some frames selected from two videos, where the human attention is attracted by moving objects or the moving parts of objects.


LEDOV
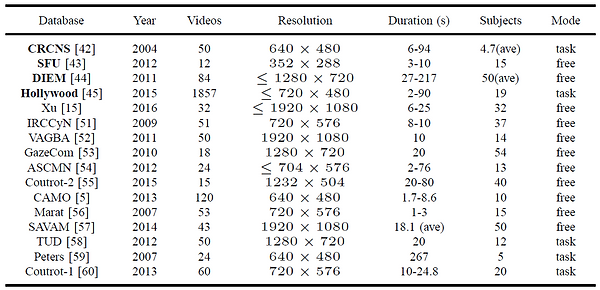
As shown in table below, existing databases for video saliency prediction lack sufficient eye-tracking data for training DNNs. Although Hollywood contains 1857 videos, it mainly focuses on task-driven visual saliency. Moreover, the video content of Hollywood is limited, only involving human actions of movies. In fact, a large-scale eye-tracking database for video should satisfy 3 criteria: 1) a large number of videos, 2) sufficient subjects, and 3) various video content. In this paper, we establish a large-scale eye-tracking database of videos to facilitate future research.
Existing eye-tracking video datsets.

Categories of videos in our database based on content.

The CC results of temporal attention correlation, averaged over animal, human, man-made object and all videos in LEDOV
To quantify the correlation between human attention and objectness, we measure the proportion of fixations falling into object regions to those of all regions. In the figure below, we show the fixation proportion at an increased number of candidate objects, averaged over all videos in LEDOV. As shown in the left figure, the proportion of fixation hitting on object regions is much higher than that hitting on random regions. This implies that a high correlation exists between objectness and human attention when viewing videos. The left figure also shows that the fixation proportion increases alongside more candidate objects, which indicates that human attention may be attracted by more than one object. In addition, we measure the proportion of fixation area inside the object to the entire object area. The right figure shows the results of such proportion at an increased number of detected candidate objects. As shown in this figure, the proportion of fixation area decreases with more candidate objects.
Proportion of fixations belonging to 10 groups, ranked according to the motion intensity.